- Table of Contents
- I. Introduction
- II. Department Profile
- III. Our Strategic Initiatives
- Initiative: Expand Services to New and Underserved Student Populations
- Initiative: Embrace Diversity and Strive for Inclusive and Organizational Excellence
- Initiative: Pursue Operational Excellence and Outgrow Our Reputation
- Initiative: Mitigate COVID-19, Recover and Build Forward
- IV. Next Steps
- Appendix A: Strategic Plan Process and Timeline
- Appendix B: UC Davis and Student Affairs Resources & Documents
- Appendix C: Student Housing and Dining Services Resources and Documents
- Appendix D: Residence Halls and The Green at West Village Bed Space Supply and Demand, fall 2020-spring 2026
- Appendix E: COVID-19 Budget Impact Summary
- Full Strategic Plan
Student Housing and Dining Services Strategic Plan2021
X. Appendix E: Residence Hall Bed Space Supply and Demand
The following table and graphs portray supply and demand projections through academic year 2017-18 for the populations served by Student Housing. Supply projections are based on existing and future residence hall revenue generating bed space including all currently planned new construction, renovation and facilities’ retirements (Appendix F). Demand forecasts are projected based on the August 2008 Campus Enrollment Plan for the 2009-10 Regents Budget with the following planning assumptions for enrollment and Student Housing take rates (in priority order):
The Department’s mission of fiscal responsibility is achieved in many ways, but in no more important way than by strategically balancing uncertain enrollment and admissions patterns with bed space inventory and capital planning. As the graphs illustrate, the tiered priority of the populations served provides flexibility to address the large range (low to high) of enrollment and housing demand. This is a conservative financial strategy and may contrast with other UC campuses which do not have a competitive off-campus housing market as does Davis and may therefore provide housing guarantees to a larger portion of their student population.
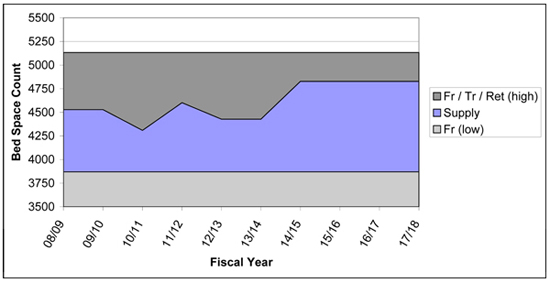
GRAPH 1. ResHall Bed Space Count - Supply v Demand Range - All Populations
As Graph 1 illustrates, bed space supply is in the middle of the low-to-high range of demand for all populations served throughout the 10-year time horizon. This is ideal. A supply less than demand would not be capable of meeting programmatic goals and supply exceeding demand would represent financial risk.
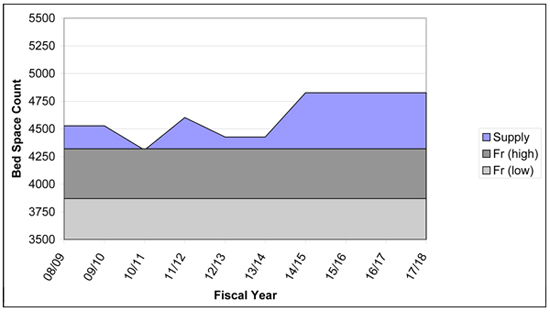
GRAPH 2. ResHall Bed Space Count - Supply v Demand Range - Freshman Population
As Graph 2 illustrates, bed space supply is at or above the highest projections of Freshman demand in all years, demonstrating our ability to meet the Freshman guarantee.
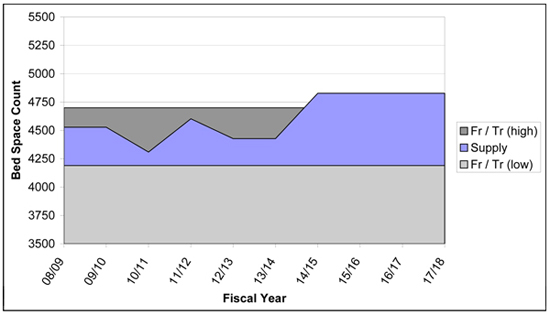
GRAPH 3. ResHall Bed Space Count - Supply v Demand Range - Freshman + Transfer Populations
As Graph 3 illustrates, over the 10-year timeframe, bed space supply satisfies the middle to the highest-level projections when the Transfer Student population is added. Because the 20% housing goal is an on-campus goal shared between Student Housing and the West Village neighborhood project, in fact, we can expect to meet the Transfer Student demand to live on-campus when the first phase of West Village is completed.
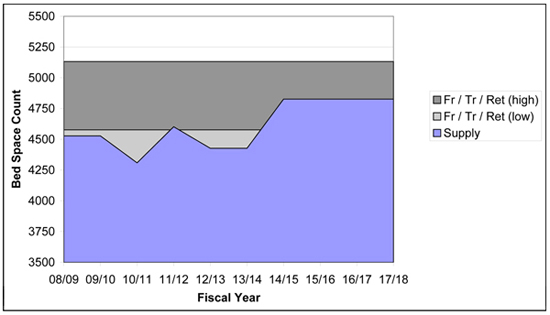
GRAPH 4. ResHall Bed Space Count - Supply v Demand Range - Freshman + Transfers + Returner Populations
Finally, as Graph 4 illustrates, beginning in FY 14/15, bed space supply satisfies the mid-level range of projections when the Returning Freshman Students are added. This corresponds with the completion of Tercero Phase 3. Again, this is ideal, providing options to this student population while not over-building and venturing too close to the demand threshold for all populations.
While the graphs portray the low-to-high range of each group, in reality, enrollment, admissions and take rates will fluctuate within each range and the actual number of any population served will vary based on actual experience.


 Follow @ucdavishousing